
Monthly Market Summary
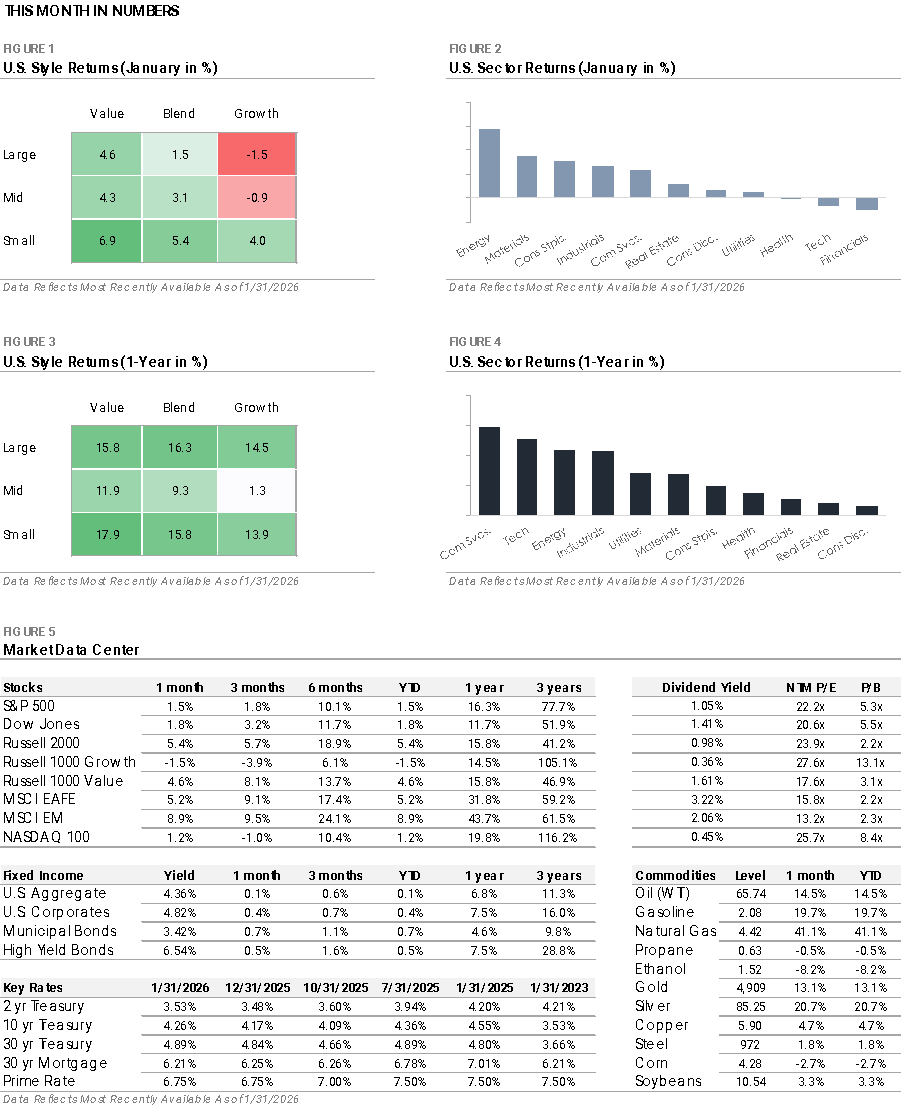
- The S&P 500 Index gained +1.5% in January, setting a new high as it traded above 7,000 for the first time. Large Cap Growth declined -1.5% as tech stocks traded lower, while Large Cap Value rose +4.6%. The Russell 2000 returned +5.4% and set new highs as market leadership rotated toward smaller companies.
- Energy led all S&P 500 sectors with a +14.4% return as oil prices rose nearly +15%. Seven of the eleven S&P 500 sectors outperformed the index, while the Financials, Technology, and Health Care sectors each traded lower.
- Bonds produced modest gains despite rising Treasury yields, with the U.S. Bond Aggregate gaining +0.1%. Corporate bonds outperformed as credit spreads tightened, with investment-grade gaining +0.4% and high-yield returning +0.5%.
- International stocks outperformed the S&P 500 as the U.S. dollar fell to a nearly 4-year low. Developed Markets gained +5.2%, outperforming the S&P 500 but underperforming Emerging Markets’ +8.9% return.
Economic Activity Remains Solid Despite Weak Sentiment
Economic data continues to highlight a widening gap between how people feel and how the economy is performing. Measures of real activity, such as retail sales and industrial production, indicate the economy ended 2025 with solid momentum. In contrast, consumer confidence fell to multi-year lows, driven by concerns about inflation, job security, and geopolitical uncertainty, and an index of manufacturing conditions remained in contraction. The gap between sentiment and behavior has been a recurring theme over the past 12 months. Despite weak consumer and business confidence, data that measures actual spending and economic activity is supportive of continued growth.
Treasury Yields Rise as the Fed Pauses its Rate-Cutting Cycle Again
Treasury yields rose in January in anticipation that the Federal Reserve would pause its rate-cutting cycle. The shift was driven by better-than-expected economic data and signs of stabilization in the labor market. While job growth continued to slow and the number of job openings fell, unemployment unexpectedly declined and jobless claims remained low. The data points to a continued hiring slowdown, but the lack of widespread layoffs signals underlying stability. Overall, January’s economic data offered little new information on inflation or growth, which allows the Fed to remain patient.
As anticipated, the Fed held interest rates steady at its late January meeting, ending a streak of three consecutive 0.25% cuts in late 2025. The policy statement struck a more optimistic tone compared to recent months, describing consumer spending and business activity as solid despite disruptions from the Q4 government shutdown. The Fed’s decision and commentary signal a wait-and-see approach as policymakers assess the lagged impact of last year’s cuts. Based on pricing in futures markets, the next rate cut isn’t expected until June.
Market Leadership Broadens & Commodity Prices Spike
Two market themes defined the month. First, market leadership shifted away from mega-cap technology stocks. Major indexes traded higher, but the average stock outperformed the index. The equal-weighted S&P 500 outperformed the traditional market-cap-weighted index, small-cap stocks outperformed the S&P 500 by nearly +4%, and the Value factor outperformed the Growth factor by over +5%. The rotation is a significant change after a small group of mega-cap stocks drove a large portion of the stock market’s recent gains. The shift is attributed to an improving economic outlook and a catch-up trade, as expensive mega-cap technology valuations prompt a rotation into more traditional, domestically focused companies that will benefit from lower interest rates and trade at more attractive valuations.
The second theme was a sharp rally in the commodity market. Despite late month volatility, gold rose +10% to a new high, silver surged over +20% to a new high, and oil prices rose to the highest level since last September. Investors turned to commodities as a hedge against global uncertainty, driven by geopolitical tensions, policy uncertainty, and a weaker U.S. dollar. The strength in commodity markets made Energy and Materials the top two performing sectors. This year’s start, with the stock market rotation and commodity rally, highlights how portfolio diversification can help smooth results when leadership shifts.
The information herein was obtained from sources which MarketDesk Research LLC (MDR) believes to be reliable, but we do not guarantee its accuracy. Neither the information, nor any opinions expressed, constitute a solicitation of the purchase or sale of any securities or related instruments. MDR is not responsible for any losses incurred from any use of this information.
Important Disclosures
The information and opinions provided herein are provided as general market commentary only and are subject to change at any time without notice. This commentary may contain forward-looking statements that are subject to various risks and uncertainties. None of the events or outcomes mentioned here may come to pass, and actual results may differ materially from those expressed or implied in these statements. No mention of a particular security, index, or other instrument in this report constitutes a recommendation to buy, sell, or hold that or any other security, nor does it constitute an opinion on the suitability of any security or index. The report is strictly an informational publication and has been prepared without regard to the particular investments and circumstances of the recipient.
Past performance does not guarantee or indicate future results. Any index performance mentioned is for illustrative purposes only and does not reflect any management fees, transaction costs, or expenses. Indexes are unmanaged, and one cannot invest directly in an index. Index performance does not represent the actual performance that would be achieved by investing in a fund.
The S&P 500 is an unmanaged index of 500 widely held stocks that is generally considered representative of the U.S. stock market.
The Dow Jones Industrial Average (DJIA), commonly known as “The Dow” is an index representing 30 stock of companies maintained and reviewed by the editors of the Wall Street Journal.
Russell 2000: This index covers 2000 of the smallest companies in the Russell 3000 index, which ranks the 3000 largest U.S. companies by market capitalization. The Russell 2000 represents approximately 10% of the Russell 3000 total market capitalization. This Index includes the effects of reinvested dividends. Russell 1000 Growth: This index represents a segment of the Russell 1000 index with a greater-than-average growth orientation. Companies in this index have higher price-to-book and price-earnings ratios, lower dividend yields and higher forecasted growth values. This Index includes the effects of reinvested dividends. Russell 1000 Value: This represents a segment of the Russell 1000 index with a less-than-average growth orientation. Companies in this index have a low price-to-book and price-earnings ratios, higher dividend yields an lower forecasted growth values. This Index includes the effects of reinvested dividends.
MSCI EAFE (European, Australasia, Far East) Index: A free float-adjusted market capitalization index that is designed to measure the equity market performance of developed markets, excluding the United States & Canada. The index consists of the following 21 developed market countries: Australia, Austria, Belgium, Denmark, Finland, France, Germany, Hong Kong, Ireland, Israel, Italy, Japan, Netherlands, New Zealand, Norway, Portugal, Singapore, Spain, Sweden, Switzerland, and the United Kingdom.
MSCI Emerging Market Index: A free float-adjusted market capitalization index that is designed to measure equity market performance of emerging markets. The index consists of the following 24 emerging market country indices: Brazil, Chile, China, Colombia, Czech Republic, Egypt, Greece, Hungary, India, Indonesia, Korea, Malaysia, Mexico, Peru, Philippines, Poland, Qatar, Saudi Arabia, South Africa, Taiwan, Thailand, Turkey, and the United Arab Emirates.
NASDAQ 100 is a modified capitalization-weighted index made up of around 100 equity securities issued by the largest non-financial companies listed on the NASDAQ.
Investing in commodities is speculative due to high potential for loss. Markets are volatile, with sharp price fluctuations evening during overall price increases.
Style Box Performance: Russell 1000 Value, S&P 500, Russell 1000 Growth, Russell Midcap Value, Russell Midcap, Russell Midcap Growth, Russell 2000 Value, Russell 2000, Russell 2000 Growth.
Sector Performance: S&P 500 Consumer Discretionary, S&P 500 Consumer Staples, S&P 500 Energy, S&P 500 Financial, S&P 500 Health Care, S&P 500 Industrial, S&P 500 Materials, S&P 500 Technology, S&P 500 Communication Services, S&P 500 Utilities, S&P 500 Real Estate.
Market Data Center: S&P 500, DJ Industrial Average, Russell 2000, Russell 1000 Growth, Russell 1000 Value, MSCI EAFE, MSCI EM (Emerging Markets), NASDAQ100 Index, Bloomberg US Aggregate, ICE BofA US Corporate, ICE BofA US Broad Municipal, ICE BofA US High Yield.
Fixed Income Yields and Key Rates: Bloomberg US Aggregate, ICE BofA US Corporate, ICE BofA US Municipal Securities, ICE BofA US High Yield, 2 Year US Treasury Bond, 10 Year US Treasury Bond, 30 Year US Treasury Bond, 30 Year US Fixed Mortgage Rate, US Prime Rate,
Commodity Prices: Crude Oil WTI (NYM $/bbl), Gasoline Regular U.S. Gulf Coast ($/gal), Natural Gas (NYM $/mmbtu), Propane (NYM $/gal), Ethanol (CRB $/gallon), Gold (NYM $/ozt), Silver (NYM $/ozt), Copper NYMEX ($/lb), U.S. Midwest Domestic Hot-Rolled Coil Steel (NYM $/st), Corn (CBT $/bu), Soybeans (Chicago $/bu).